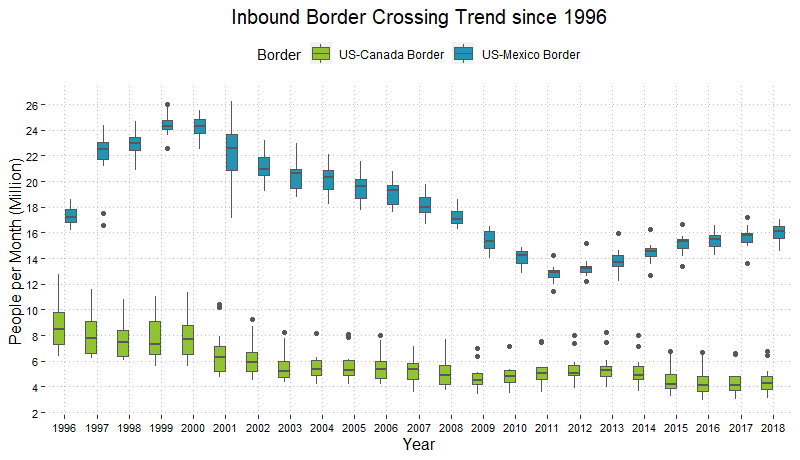
Boss of all plots - Box plots
I totally love boxplots, so much so that I may be even guilty of overusing it sometimes (if there is such a thing). Using just averages or percentile values is simplistic but they take away so much in terms of information. Histograms or Density plots work fine for showing individual distributions but may not work as well for comparisons. Boxplots are a great way to visualize and compare distributions across multiple groups or categories within the data in a concise way.


