

Creating Org Charts using igraph
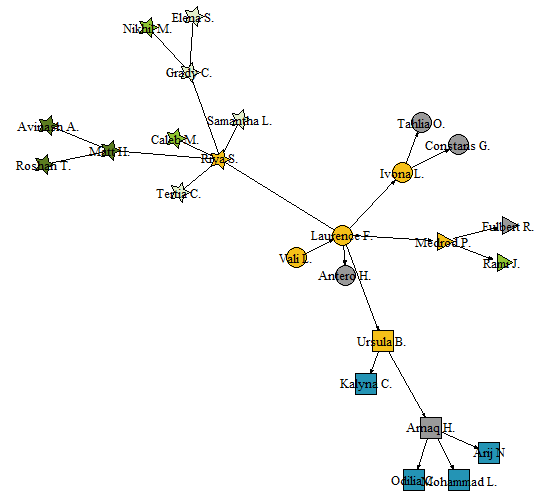
In this post we will create some Organizational charts using the ‘igraph’ package in R. Network diagrams work great for representing team relationships or other connections amongst employees in an Org chart. An employee appears as a “node” or “vertice” of the network, while the relationships are represented by the “edges” or “links” that connect the nodes. We can also use the attributes such as color, shape and size to show team formations, specific roles or hierarchy.